Showing posts with label data collection. Show all posts

Friday, March 16, 2012

Making Predictions

Making predictions is an important step in all data collection activities.  After a brief explanation of the problem or experiment, students are asked to think about what they expect the results to be and make a prediction.  The teacher leads a discussion of the predictions and the reasoning behind them, often posting these on chart paper for future reference during the data analysis phase.


I recently read a study on this very subject.  It found that having students make predictions about new math situations or problems did indeed foster deeper mathematical thinking and understanding in students.  Additionally, this practice also increased student engagement in the task, as they were invested in the results.


One data collection activity I have used with students from kindergarten through middle school, is the Cheerios Investigation.  Students are told about an advertising campaign in which Cheerios randomly includes one of six toys in each box of Cheerios.  They hope that this will prompt families to buy more boxes of Cheerios trying to get all six toys.  Students are asked to think about this and predict how many boxes of Cheerios the average family would need to buy to get all six toys.


The teacher then leads a discussion about the predictions, including the reasoning behind them.   In my experience, there's always the eternal optimist (or naive person) who says six.  Then there's the off-the-cuff response of 100 or some other large number.  The most popular response is 36, although I've yet to hear an adequate mathematical reason for that number.  Nonetheless, the teacher accepts all predictions and reasoning, posting them on a chart for later reference.


Students then conduct the simulation, using a die and tallying the results until they have indeed gotten each of the six toys (each toy represented by a number 1-6 on the die).  They post their results on the class line plot, then repeat the experiment as time allows.


The class line plot is the basis for the data analysis.  Students may compare their small sample to the larger class sample.  Discussion may include mean, median, mode, range, outliers, etc., as appropriate for the class level.  Finally, students are asked to write an analysis of the data, this time in a letter to Mr. (or Mrs.) Oats, explaining why the plan to include toys will increase the number of boxes of Cheerios families will buy.


It's a simple activity but it leads to rich mathematical discussion and students are actively involved and engaged in the results from beginning to end.  Additionally, if several classes in the school conduct this experiment, classes can share results to generate an even larger sample.

See  Mathwire's Cereal Toy Investigation to view a lesson plan and download handouts.


Mathwire also offers the Cereal Toy Investigation applet, designed to allow students to quickly generate larger samples, extending the die-toss experience.  Students simply click the Next Box button to buy another cereal box.  The applet is designed to stop when the student has accumulated all six toys so that students may record this number before running another trial.   [Note:  This app requires Java.]


Tuesday, February 21, 2012

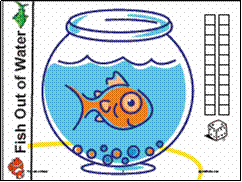
Fish out of Water Game

This is a simple counting game, designed by a Monmouth University student.  It's a great game for Dr. Seuss day, accompanying One Fish, Two Fish, Red Fish, Blue Fish.  Students begin with 20 fish out of water, toss a die, and place that many fish back in the bowl.


While the file provides a game mat, teachers might choose to use a bowl and fish manipulatives.  It's fairly easy to find plastic fish in dollar stores.  Plastic fruit containers from the grocery store simulate a fish bowl and the lid can be used to store the pieces in the fish bowl for use in the math center.


Although the game was designed as counting practice for young students, it may be enriched to provide a data collection activity for older students.  Given the premise of the game, students are asked to estimate how many times they will have to toss the die to get all of the fish back in the bowl.  Students then play the game several times, collect data and add it to class results.  Students analyze the data in small groups and draw conclusions backed up by the data.  The teacher then leads a class analysis of the data.


Download Fish out of Water, which includes game mats for a single player, two players, center icons, and directions.  Add this game to the math center for independent practice.

Friday, December 16, 2011

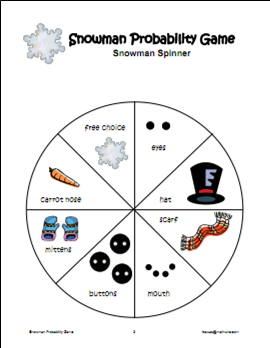
Snowman Probability

This activity is designed as a fun, seasonal data collection activity that introduces students to the probability of a spinner.  Although each piece of the snowman is equally likely to be spun, the actual game results are often quite different.


In this game, students spin to win all of the pieces to create the snowman.  Students may place a transparent spinner over the spinner template, or use a pencil and paper clip to create a spinner.


Before playing, ask students to estimate how many spins they think they will need to collect all of the pieces for their snowman.  Call on students to share both their number of spins and why they think that is a reasonable number.  Record these estimates for later discussion.


Give each student a copy of the game mat and insert the mat into a clear sheet protector.  Students may then use dry erase pens to draw the pieces as they collect them.


Have students use the Snowman Probability Recording Sheet to collect data on how many spins it takes to get all of the pieces.  Insert this sheet in a clear sheet protector for a renewable activity.  Be sure to collate the class data and analyze this larger sample to get an approximate number of spins required.


Download the Snowman Probability Game file which includes the game mat, spinner, directions and recording sheet.  

Thursday, December 15, 2011

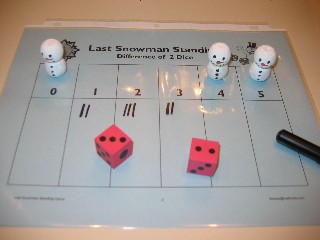
Last Snowman Standing Game

The snowmen face off in this game of addition facts. But beware! A toss of the die may mean the sun melts a snowman. Students practice addition facts as they try to be the last snowman standing because in this game the first person to remove all of his/her snowmen loses the game!

Download the  Last Snowman Standing Game for directions and game mats for three different versions of the game:
  • Sum of Two Dice Version to practice addition facts
  • Difference of Two Dice Version to practice subtraction facts
  • One Die Toss for a simplified version to analyze the probability of a die toss
Data Collection: The directions for each version also include directions for data collection and analysis of the outcomes of the games. Be sure to incorporate these activities, if at all possible, as games offer a highly motivational study in probability. Students love to "play games" to collect data. They're also eager to analyze games so that they learn how the game works and what strategies they can use to improve their odds of winning.

Differentiation: This game offers many opportunities to differentiate the activity. First of all, teachers are able to select from three different versions. Secondly, each teacher should differentiate the game analysis to meet the instructional level of his/her students. Most students can handle the questions with teacher guidance. Older students and talented primary students may be challenged to analyze the game and answer the questions in small groups.


Read about the Last Snowman Standing game on Mathwire.

Friday, December 2, 2011

Counting Game: Run, Gingerbread Men, Run!


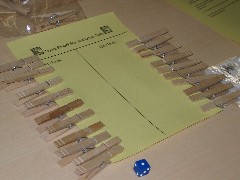
This game was designed to introduce students to the randomness of spinners and dice. Each color gingerbread man starts at the same place and has the same chance of winning by crossing the finish line, but does it work out that way? Students will enjoy playing the game AND use a clothespin graph [see sample on right] to collect some useful data on the winners.

Once students have collected class data from playing many games, they will come together to analyze the clothespin graph results. Students will be asked to discuss whether or not they think the game is fair for all of the gingerbread men and explain their reasoning.

Download the Run, Gingerbread Men, Run! game so that students can get started playing and collecting data. The pdf file contains the spinner, gameboard, clothespin graph icons, and an optional tally sheet.


Sunday, October 16, 2011

Bat Probability

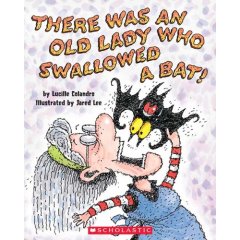
There Was An Old Lady Who Swallowed A Bat!
by Lucille Colandro

After reading the book, investigate Batty Old Lady Probability.  Students spin to collect all of the items the Batty Old Lady swallowed, and tally each spin on the recording sheet. They then calculate the total spins it took them to get all 7 items, and add that figure to the class data. Teachers may help students analyze the class data and learn about probability in the process. The pdf document includes directions, game mat, picture cards, spinner, recording sheet and writing to learn handout.

Friday, September 2, 2011

What's Your Favorite Number?

Alex Bellos is fascinated with numbers.  As an author of books on numbers, he's been asked countless times what his favorite number is.  He decided to conduct a survey to find out what numbers people most liked.  He promises to publish the results of this worldwide survey in 2012.


Students can also take part in the survey which simply asks you to input your favorite number and explain why it is your favorite.  It would be fun for students to take part in this easy survey and they'd surely be interested in the results when they are available.  Visit the Alex Bellos Blog to read about the survey idea and to enter your favorite number.


Extension:   Extend this online activity by conducting a classroom survey of favorite numbers.  You might use the same format that Bellos uses online.  Students would collect data, then organize the data presenting it in graphical form before analyzing the results.  Students might elect to organize a schoolwide survey to see if the classroom results match this larger sample.


Wednesday, May 25, 2011

Online Resource: Probability Spinners

Math Playground:  Spinner
This online site allows users to customize a spinner by colors, then spin for trials.  There is a graph option to display the results by color as they are generated.  This is an effective online resource for data collection.  Students may easily generate data from larger trials than through the use of a real spinner.  


Many teachers use this kind of online generator after student's initial experience with classroom spinners and discussion of the resulting data from this small trial.  Students generate hypotheses which may be easily investigated using this online resource to capture more data.  A resulting data analysis confirms or disputes the hypotheses and should include a discussion of the use of online generators and randomness.


Note:  This site allows the user to customize the spinner by adding labels to each section (e.g. numbers, names, etc.) and to select how many different outcomes there will be.


Check out Math Playground's Probability Spinner.

Tuesday, April 5, 2011

Question of the Day


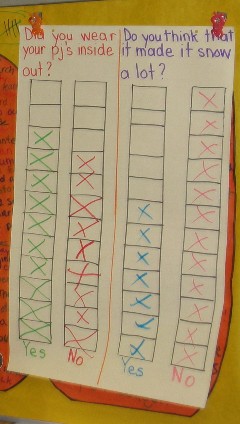
Collecting, organizing and analyzing data are essential skills in today's world.  Some teachers incorporate daily practice by including a question of the day in the morning routines.  Students have markers with their names, and they are accustomed to completing this task when they arrive in the classroom, placing their marker in the correct spot.  If students are non-readers, assign one student to be the interviewer, repeating the question to classmates as they arrive in the classroom.


Suggestions:   
  • Vary the format of the data organization, providing practice by using bar graphs, clothespin graph, Venn diagram, tally chart, line plot, glyph, etc.
  • Use seasonal, weather, holiday prompts to collect data.
  • Coordinate math question of the day to current literature, science or social studies units.
  • Extend assembly and field trip experiences by graphing data about the particular theme.
  • Check out this list of data questions for young learners.

Wednesday, February 23, 2011

Heads & Tails Data Collection

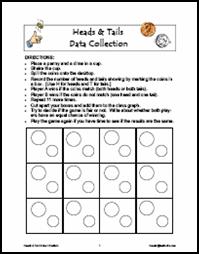
In this activity, students toss a penny and a dime and record whether the outcome is HH, TT, or HT and which coin is heads or tails.   Students cut apart their results and add them to the class results to create a class pictograph which can be analyzed and compared to the expected outcomes.   Students analyze the results to determine if the game is fair or unfair. 

It is important to use two different coins so that students see that the coins matching (HH or TT) and the coins not matching (HT or TH) are equally likely outcomes. Students often respond initially that the game is unfair because the player who wins when the coins match has two chances to win while the other player only has one chance. Using two different coins and recording the results of both coins helps students dispel this initial misconception as they analyze the graph results and create a tree diagram for the event. 

Download Heads & Tails Data Collection which includes the student recording sheet and directions for creating a class graph.

Tuesday, February 22, 2011

Clothespin Graph

Write each student's name on a clothespin. A piece of foam core board or laminated oak tag makes a great two-choice (Yes/No) graph board. Students simply affix the clothespin to the correct side to indicate their response. Students can easily "see" the results and count to verify the outcome.
  • Use this method to record the results of informal classroom surveys:
    • Literature: Which character do you like best? What do you think the character will do next? Which version of the story do you prefer?
    • Daily Routines: Are you buying lunch or did you bring lunch? Present or Absent?
  • Ask students to report the results of who won two-player games so that the class can analyze the fairness of the games. 
Suggested Use:  Use a clothespin graph to record the results of students playing the Heads & Tails Game.  

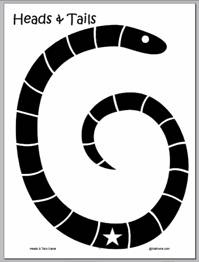
In this game, each student places a penny on the star.  One student is heads and the other student is tails.   Students should place their pennies with the appropriate side up.

The heads student tosses a penny and moves a space toward the head if the outcome is heads.  If the outcome is tails, the student does not move.  Play repeats with the tails student, who moves only if his/her toss is tails, moving toward the tail of the snake.  The first player to read the head or the tail of the snake wins.  The winning player should add a clothespin to the graph to record the win as heads or tails.

Class discussion should focus on analyzing the data to determine if the game is fair or not.   Directions and gameboard are included in the download.   This game was developed by a Monmouth University student for the Probability Fair. 


Download the Heads & Tails Game which includes the game mat, directions and icons for centers work boards.  This game is an excellent addition to a classroom math center, as students may play with a partner and record the results for class discussion at a later time.

Monday, February 21, 2011

Data Collection: Count in a Minute

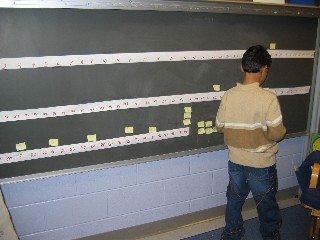
Count in a Minute: First graders at Flynn School in Perth Amboy, NJ, created a large line plot of how high they could count in a minute. Student pairs worked together to time and count then post the results on the class graph.
  • The teacher presented the question to the class: How high do you think most first graders in this class can count in a minute? The teacher led a discussion that included student predictions and the reasons for their predictions.
  • The teacher created a large number line on the blackboard to form the basis of the line plot. The teacher used a timer to signal the start and end of the minute.
  • Students worked in pairs. First, student A counted aloud while student B listened. When the minute was over, student B wrote the highest number on a post-it and added it to the class results.
  • Students repeated the experiment: student B counted aloud while student A listened. These results were then added to the class results.
  • Data Analysis:  The teacher led a discussion of the results and whether or not the results were what they predicted. Why or why not?

Friday, February 18, 2011

Sampling: Mystery Bag

In the Mystery Bag activity, students take samples from four different bags and use those samples to predict the contents of the whole bag.   Students will tally the results of the samples, compare samples and match the samples to descriptions of the four bags.   Finally, small groups will report sample results to the whole class so that the class is able to review the results of this larger sample and decide if their predictions still hold. 

Sampling is used in polls, advertising, TV ratings, etc.  In this activity students will see firsthand how the size of the sample affects the accuracy.  Individual groups may pull skewed samples, but when the class data is combined, these larger samples should more accurately reflect the actual contents.  NOTE:  Be sure that students understand that they are sampling with replacement, meaning that they pull a tile, record the outcome, then replace the tile in the bag before pulling the next tile.

Download all materials and instructions for the Mystery Bag activity from Mathwire.

Tuesday, February 15, 2011

Online Cereal Toy Investigation Simulator


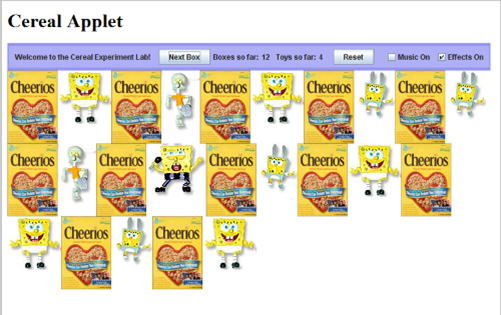
This applet, designed by Erin Mulder, allows students to conduct multiple simulations and collect data on a larger sample.   Students may run 20-30 trials more quickly than the dice toss.   The applet is probably best used following the class data collection simulation with 6-sided dice. 

In this simulation, students will need to collect data on the total number of boxes bought to get all 6 toys so they must decide how best to record that data.   The class must also decide on a method of recording the class data (e.g. adding to the class line plot using a different color marker would facilitate comparison of the results).   Discussion should center around how well the small class sampling results matched the larger computer-generated results. 

Directions for Cereal Applet:
  • Once the Applet is loaded, click on "Next Box" to buy a box of cereal.
  • A box of Cheerios and a toy will be added to the screen.
  • Click "Next Box" again to buy another box of cereal and get a free toy.
  • Keep clicking "Next Box" until you get all six toys.
  • The applet will stop at this point and tell you how many boxes you had to buy to get all six toys.
  • Students can then see how many of each toy they got.
  • When students have recorded this information for the trial, they click on "Reset" to begin a new trial.
  • Students should add these computer simulations to the class data for discussion. 
Run the online Cereal Toy Investigation Simulator.  [Java applet requires Java-enabled browser.]

Monday, February 14, 2011

Cereal Toy Investigation

This activity introduces students to the use of sampling for advertising purposes.   It also generates a discussion about how advertisers use gimmicks to get people to buy more of their product.   Even young students will admit that they have been induced to buy fast food meals in order to collect all of the toys.

The Plan: Many companies are putting toys in their products to try to get customers to buy more.   The company that makes Cheerios thinks this might be a good way to get families to buy more boxes of Cheerios.   They will make six different toys and put one in each box of Cheerios and Multi-Grain Cheerios.   That way kids will want their parents to keep buying Cheerios until they have all six different toys. 

Mrs. Oats, the President in charge of Cheerios, asks you to help figure out if this is a good plan.   She knows that it will cost more to put toys in Cheerios.   She wants to be sure that families will really buy more boxes of Cheerios to get the toys.  Mrs. Oats asks you to find the answers to these two questions:
  • What toy should Cheerios put in the boxes to make families want to buy more?
  • How many boxes will a family buy to be sure they collect all 6 toys?

"Guess"-timate: 
  • Ask students to think about how many boxes a family will have to buy to get all 6 different toys.
  • Have students share their "guess"-timates with the class and explain how they decided on that number.
  • Write all "guess"-timates on the board or chart paper for later reference. 
Read more about the Cereal Toy Investigation on Mathwire where you can view a step-by-step lesson plan and download materials needed for this data investigation.

Thursday, February 10, 2011

Game of Pig

Game of Pig:  one die version

This is best introduced as a class activity.   Students collect points for each toss of the die unless a ONE is tossed, which means they lose all of the points they have collected in the round.   To prevent losing their points, students may elect to stop at any point in the game before a ONE is tossed and they get to keep the points they collected but get no further points.   Students love the game and begin to appreciate that theoretical probability and experimental probability are often quite different! 

Game Analysis:  Once students are familiar with the game, encourage small groups to develop a "winning strategy" and explain it to their classmates. Then play the class game with groups competing to see who has the best strategy in the actual game. Repeat, as necessary, for students to modify strategies.  NOTE:  Some student strategies are:  stopping after 5 tosses, stopping when they have 20 points, stopping after the second toss of a 6 or a 5, etc.  Be sure to ask students to explain the thinking behind the strategy.

Terry's Note:  I have used this with students in Grades 1-12 as well as in teacher training sessions and everyone loves it!  Students record each toss and then must add up a string of numbers providing great practice in mental math.  Students also continue to search for that magic strategy that will help them win.  Along the way, they informally experience, and thus learn, a lot about experimental probability.  I found this game to be a great use of those few minutes at the end of class to keep students actively engaged.  No student ever groaned when I said we were going to play pig!
  • Download directions for playing the Pig Game in a whole class setting.
  • Download the Pig Template to use as a recording sheet.  Place the sheet in a plastic sheet protector and use dry erase markers to create a reusable recording sheet.
  • Have students record each die toss in a Pig Tally Template for easy data collection.  This method also groups data so that students see a visual representation of the frequency of each outcome.
  • Use copies of the Pig Handout as a writing activity.  Encourage students to write about the probability in Pig and what they have learned from playing the game.  OR use these sheets for student groups to write out their "winning strategy" and post them on a bulletin board for future reference.  Keep a running total of times each strategy is successful in winning.
  • Play Pig online.
  
Game of Pig:  Two dice version
Students should be familiar with the one-die version of Pig before playing the 2-dice version.   Tossing a one on either die means that the player loses all points collected in that round, if he/she has not stopped before the one is thrown.   Any player who is still playing when snake-eyes (double ones) are thrown, loses all points collected thus far in the whole game! 

Game Analysis:  Students need to develop different strategies for playing this 2-dice version of Pig.   After playing several times, student pairs might analyze the two-dice frequency chart to calculate the probability of a one being tossed.   Students can use this information to develop a winning strategy and compete against other teams to see whose strategy is most successful. 
  • Download  a two-dice toss frequency chart for students to use in determining the probability of different outcomes.
  • See online directions for playing Two-dice Pig.
  • Play an online version of Two-dice Pig against the computer.
  • See Two Dice Roll for an online simulation of two-dice toss that graphs the outcomes.  This is a great way for students to collect larger samples of data to analyze experimental probability against theoretical probability.  Groups of students might also use this simulator to generate dice tosses to test their winning strategies.

 Game of Skunk
After students have mastered the Pig Game, analyzed the probability of the game and identified winning strategies, introduce the Game of Skunk and challenge students to analyze the probability used in this game and develop a winning strategy.   How are the games alike and how are they different?   Does the same "winning strategy" work for both games?  

Tuesday, February 1, 2011

Valentine Probability

These Valentine's Day activities are based on the small candy hearts popular around this holiday. Instead of sayings, these mathematical hearts have letters. 

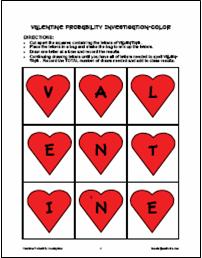
Students are trying to accumulate all of the letters in the word VALENTINE or HEART. They first predict how many letters they will have to draw from the bag, then they conduct the experiment, collect and organize data and analyze the class results. 


Materials:
  • Download Valentine Probability for a straightforward probability handout.
  • Download Valentine Probability Investigation for the hearts and recording sheet to conduct the probability investigation on how many letters students will have to draw (with replacement) to get all of the letters in the word VALENTINE. 
  • Download Heart Probability Investigation for the hearts and recording sheet to conduct the simplified probability investigation on how many letters students will have to draw (with replacement) to get all of the letters in the word HEART.

Wednesday, January 19, 2011

The M&M Game

M and M Game: 2-dice Version 
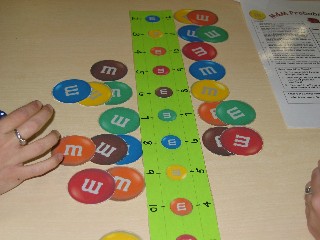
Students place M&M markers on the numbers 2-12.   Students may place one M&M marker on each number or place several on some numbers and leave other numbers blank.   Next, students toss two 6-sided dice, find the sum, and remove an M&M marker from that number, if there is still one.   The first player to remove all markers wins the game. 

This game helps students develop an understanding of the probability of a two-dice throw.  As students play the game, they practice addition facts, but they also learn that some sums are tossed more frequently than others.  This hands-on experience is then solidified with a discussion of all of the possible outcomes, creating a chart to visually capture the data.

Next, students play the game again with this mathematical knowledge and discuss how this information impacts the placement of M&Ms.  Couple this game-playing with class data collection and students may then compare theoretical and experimental probability of a larger sample.

This is just one example of how a simple game may be used as a data collection activity to develop student understanding of theoretical and experimental probability concepts.  Some teachers question the use of games in the classroom pressed for time.  In my experience, this rich use of games to practice basic facts AND as a data collection activity is time well-spent and students respond positively to both the practice and the discussion of these hands-on, fun experiences.

NOTE:  This game, created by Susie Siegel as a grad school project, uses a sentence strip as the number line.  The M&M pieces were created using PowerPoint.  Teachers may choose to laminate the pieces for use in a classroom math center.


MATERIALS:
  • Download Ms. Siegel's M&M Game directions and recording sheet.
  • Download a picture, alternate recording sheet and directions for using that recording sheet.  NOTE:  This recording sheet was designed to fit into a sheet protector so that students may use dry erase markers to play and record data.  This option may be used without the M&M game pieces.
  • Download the 2-dice toss recording sheet for a discussion of the theoretical probability of tossing two dice.  Students write one outcome that produces that sum in each box to create a visual display.   NOTE:  use different colored dice for this activity so that students are able to see that tossing 4 on the red die and 3 on the blue die is different from tossing 3 on the red die and 4 on the blue die.  Both must be counted as outcomes.  Students might benefit from actually using two different color markers to record these outcomes as well.
  • Download M&M pieces for use in playing the game.

Sunday, January 16, 2011

Penguin Math Games

Capture the Penguins Game uses the outcome of two-dice toss to form a coordinate pair. Students toss two dice (one regular and one A-F) in this fun game that introduces students to coordinate graphing in the spaces.   Students form a coordinate pair based on the dice toss and capture a penguin, if possible.   Students use the accompanying recording sheet to keep score during the game. 
  • A-F Dice: Create A-F dice using plain dice or purchase small wooden cubes at a craft store to make the dice.  
  • Penguin Pieces: Penguins pictured to the right were created by painting wooden clothespins and doll stands, both readily available at craft stores. 
Download Capture the Penguins game mat, instructions and student recording sheet. 


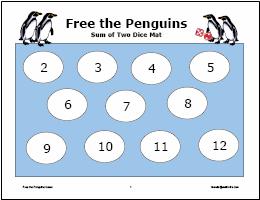
Free the Penguins Game:  The penguins are stuck on the ice floes. Only a roll of the die can free them to search for food in the ocean. Students will practice addition or subtraction facts as they try to be the first to free their penguins. Use mats with clothespin penguins for the most fun! 

These games are not only an excellent opportunity to practice basic facts but they allow students to collect data and reflect on the probability inherent in the game. Suggestions are included with this game for students to keep tallies of all dice tosses, organize the class data in a line plot, and then analyze the data for patterns and trends. 

Download Free the Penguins game mat, instructions and suggestions for data collection.


Thursday, October 7, 2010

Clothespin Graphs

Use a clothespin graph for a simple daily graphing experience.  Many teachers write each student's name on a clothespin that students then use in classroom data collection activities.  This is a simple visual data collection that lends itself to picture cues for younger students or questions for readers.

Add this graphing model to your fall classroom activities:
  • Do you like fall or winter best?
  • Do you help rake leaves?
  • Have you ever bobbed for apples?
  • Do you prefer red or green apples?
  • Will you carve a pumpkin for Halloween?
  • Will your jack-o-lantern be cute or scary?
The list could go on and on.  It's easy to divide a student white board into halves or quarters for four choices.  Students may easily clip their clothespins to the space that represents their choice.  Did heads or tails win the game? 

This data collection activity lends itself to other curricular areas as well.  For example, students might vote on their favorite version of a familiar story or vote on whether or not they were born in the same state where they currently live, etc.

Preschool and primary teachers often find that a clothespin graph is a great way to take attendance.  As students enter the classroom and get settled, they move their clothespin to the Here side.  This makes it easy for teachers to check attendance and students easily see how many people are absent(not here) that day. 

Think about ways to add a clothespin graph to math class.  Please share your ideas on using this simple yet powerful data collection tool.