
Add this graphing model to your fall classroom activities:
- Do you like fall or winter best?
- Do you help rake leaves?
- Have you ever bobbed for apples?
- Do you prefer red or green apples?
- Will you carve a pumpkin for Halloween?
- Will your jack-o-lantern be cute or scary?
This data collection activity lends itself to other curricular areas as well. For example, students might vote on their favorite version of a familiar story or vote on whether or not they were born in the same state where they currently live, etc.
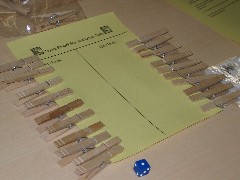
Preschool and primary teachers often find that a clothespin graph is a great way to take attendance. As students enter the classroom and get settled, they move their clothespin to the Here side. This makes it easy for teachers to check attendance and students easily see how many people are absent(not here) that day.
Think about ways to add a clothespin graph to math class. Please share your ideas on using this simple yet powerful data collection tool.

My 4K children use clothespins on a T-Graph when selecting juice or water for snack time.
ReplyDelete