Showing posts with label sampling. Show all posts

Wednesday, June 8, 2011

Data Analysis: TV Survey


TV Survey is an open-ended problem that was designed to introduce students to this real-life application of sampling. Because TV is a part of students' daily life, this scenario is accessible to all students. And, because students often exhibit a keen sense of "fairness," they are sometimes disconcerted by the notion that a small group of people get to decide what all of us get to watch on TV.

TV Survey was also designed to address different Bloom levels so that students have to use higher-order thinking skills to analyze, synthesize and evaluate information about the sampling method.


  • Download the TV Survey open-ended assessment.
See more Mathwire Sampling Activities.

Sunday, February 20, 2011

TV Survey

Sampling is a technique that is used in statistics to gather information about a lot of people or things without testing each one.   For instance, scientists pull a small container of water from the ocean to test to see if the beach is safe for swimming.   Many people follow this same procedure with their backyard pools, testing a small container to check pH levels. 

There are companies that gather this kind of information from a small number of people and make predictions about how a larger group will think or act.   For example, the Nielsen ratings gather information on which TV shows a small sample of Americans watch.   The Nielsen company then publishes which shows Americans watch the most or watch the least based on this small sample.   These are called the Nielsen ratings and they determine how much money advertisers pay for TV commercials.   The more people who watch the show, the more an advertiser will have to pay for a commercial during that show.   The Nielsen Company very carefully selects the people who participate in this sample so that they are representative of the country as a whole.   Unfortunately the end result is that sometimes your favorite TV show will not get a high Nielsen rating, and it may be cancelled by the TV station. 

TV Survey is an open-ended problem that was designed to introduce students to this real-life application of sampling.   Because TV is a part of students' daily life, this scenario is accessible to all students.   And, because students often exhibit a keen sense of "fairness," they are sometimes disconcerted by the notion that a small group of people get to decide what all of us get to watch on TV. 

TV Survey was also designed to address different Bloom levels so that students have to use higher-order thinking skills to analyze, synthesize and evaluate information about the sampling method. 

Download the TV Survey open-ended assessment.

Friday, February 18, 2011

Sampling: Mystery Bag

In the Mystery Bag activity, students take samples from four different bags and use those samples to predict the contents of the whole bag.   Students will tally the results of the samples, compare samples and match the samples to descriptions of the four bags.   Finally, small groups will report sample results to the whole class so that the class is able to review the results of this larger sample and decide if their predictions still hold. 

Sampling is used in polls, advertising, TV ratings, etc.  In this activity students will see firsthand how the size of the sample affects the accuracy.  Individual groups may pull skewed samples, but when the class data is combined, these larger samples should more accurately reflect the actual contents.  NOTE:  Be sure that students understand that they are sampling with replacement, meaning that they pull a tile, record the outcome, then replace the tile in the bag before pulling the next tile.

Download all materials and instructions for the Mystery Bag activity from Mathwire.

Monday, February 14, 2011

Cereal Toy Investigation

This activity introduces students to the use of sampling for advertising purposes.   It also generates a discussion about how advertisers use gimmicks to get people to buy more of their product.   Even young students will admit that they have been induced to buy fast food meals in order to collect all of the toys.

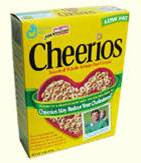
The Plan: Many companies are putting toys in their products to try to get customers to buy more.   The company that makes Cheerios thinks this might be a good way to get families to buy more boxes of Cheerios.   They will make six different toys and put one in each box of Cheerios and Multi-Grain Cheerios.   That way kids will want their parents to keep buying Cheerios until they have all six different toys. 

Mrs. Oats, the President in charge of Cheerios, asks you to help figure out if this is a good plan.   She knows that it will cost more to put toys in Cheerios.   She wants to be sure that families will really buy more boxes of Cheerios to get the toys.  Mrs. Oats asks you to find the answers to these two questions:
  • What toy should Cheerios put in the boxes to make families want to buy more?
  • How many boxes will a family buy to be sure they collect all 6 toys?

"Guess"-timate: 
  • Ask students to think about how many boxes a family will have to buy to get all 6 different toys.
  • Have students share their "guess"-timates with the class and explain how they decided on that number.
  • Write all "guess"-timates on the board or chart paper for later reference. 
Read more about the Cereal Toy Investigation on Mathwire where you can view a step-by-step lesson plan and download materials needed for this data investigation.