This month's featured graphing format is the clothespin graph which captures data from simple yes-no questions. Use a piece of oaktag or foam board to construct the actual graph part that is reused. Write the question on a sheet of paper and attach it to the top of the board. Provide clothespins for students to use to affix to the yes or no side of the graph. Some teachers write student names on the clothespins so that it is easy to see who did or didn't vote yet. 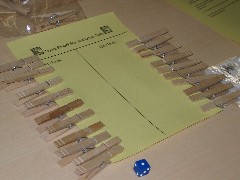
A clothespin graph may also be used to record data for any two-choice option.
|

Friday, October 14, 2011
Pumpkin Graphing

Subscribe to:
Post Comments (Atom)
I am curious to know how you incorporate this into your class time?
ReplyDeleteSome teachers reserve bulletin board space for the graph of the week. I've also seen kindergarten teachers do a graph of the day. Students become accustomed to the routine and quickly move their name markers to the correct response.
ReplyDeleteYou can tie the graph into holidays, current events, literature units, science, etc. The analysis of the results (data) are the mathematical emphasis. Asking students to interpret the data and generalize the results are important mathematical skills for life.