Monday, February 28, 2011

Problem Solving: Working Backwards

Strategy:  Make a Path

 Sometimes students must work backwards to solve a problem.  This method also works as an introduction to some algebraic problems in which the starting number is unknown.  This method and the accompanying problem sets were developed to introduce students to one method of recording these problems by creating the forward path, then reversing the operations to create a backward path students may use to work backwards and identify the starting number.


 Once students learn this method, they become quite proficient at using the paths to identify the starting number.   The paths are easily generated on blank paper or on whiteboards so that these problems are a great do-now for the beginning or end of class periods.

Suggestions for modeling this strategy:
  • Read the problem through, then model creating and labeling the forward path step-by-step, using an overhead or whiteboard.  
  • Draw arrows and circles to create a backward path that is matched arrow to arrow and circle to circle.
  • Label the backward path by using the opposite operation since students are working backwards (undoing).
  • Start at the end number and work backward along the new backward path, writing the correct number in each circle until students reach the beginning number.
  • Check work by using the beginning number along the forward path to make sure that it creates the ending number.
 Suggestions for Guided Practice:
  • Read a problem slowly, pausing at each step to allow students to create a forward path and correctly label it.
  • Read the problem  once again so that students may check their forward path.
  • Challenge students to create the backward path with labels then work backwards to identify the starting number.
  • Encourage students to check their work by using the starting number across the forward path to make sure that it works.
  • Distribute copies of the Making a Path problem sets for students to work on independently or in pairs.
Enrichment:
  • Challenge students to create their own original problems, complete with a solution and answer.  Use them as do-nows for the class and/or place these problems in the classroom math center.

Materials:

Friday, February 25, 2011

Landmark Shark Game

Everyday Math uses the Landmark Shark Game to help students practice and master the statistical landmarks of range, median and mode.  Students are dealt 5 cards and they may exchange 1-3 cards, if desired.  Next, students choose which of the statistical landmarks will give them the most points for the round and enter the correct number to score.

Try out the online demo of the Landmark Shark Game at the Everyday Mathematics site.  The site includes online directions for playing the game.   It's a well-designed game and students really learn the difference between these statistical landmarks as they try to earn the most points for each hand.

Thursday, February 24, 2011

Bar Grapher Tool

NCTM's Illumination site offers a free Bar Grapher Tool students may use to create a bar graph of their own data.  Students simply input the data, select appropriate minimum and maximum values, width of bars, color of bars, then click on Graph Data to create a bar graph.


The graph to the left represents one trial of Mathwire's Cereal Toy Applet.

 This is a useful tool for the math classroom.  Once students know how to create a bar graph with all of the necessary components, the emphasis moves more toward the analysis of results.  Allowing students to use real-world graphing applications provides more time for discussion and analysis of group results.  


Check out the Bar Grapher Tool on the NCTM Illuminations site.

Wednesday, February 23, 2011

Heads & Tails Data Collection

In this activity, students toss a penny and a dime and record whether the outcome is HH, TT, or HT and which coin is heads or tails.   Students cut apart their results and add them to the class results to create a class pictograph which can be analyzed and compared to the expected outcomes.   Students analyze the results to determine if the game is fair or unfair. 

It is important to use two different coins so that students see that the coins matching (HH or TT) and the coins not matching (HT or TH) are equally likely outcomes. Students often respond initially that the game is unfair because the player who wins when the coins match has two chances to win while the other player only has one chance. Using two different coins and recording the results of both coins helps students dispel this initial misconception as they analyze the graph results and create a tree diagram for the event. 

Download Heads & Tails Data Collection which includes the student recording sheet and directions for creating a class graph.

Tuesday, February 22, 2011

Clothespin Graph

Write each student's name on a clothespin. A piece of foam core board or laminated oak tag makes a great two-choice (Yes/No) graph board. Students simply affix the clothespin to the correct side to indicate their response. Students can easily "see" the results and count to verify the outcome.
  • Use this method to record the results of informal classroom surveys:
    • Literature: Which character do you like best? What do you think the character will do next? Which version of the story do you prefer?
    • Daily Routines: Are you buying lunch or did you bring lunch? Present or Absent?
  • Ask students to report the results of who won two-player games so that the class can analyze the fairness of the games. 
Suggested Use:  Use a clothespin graph to record the results of students playing the Heads & Tails Game.  

In this game, each student places a penny on the star.  One student is heads and the other student is tails.   Students should place their pennies with the appropriate side up.

The heads student tosses a penny and moves a space toward the head if the outcome is heads.  If the outcome is tails, the student does not move.  Play repeats with the tails student, who moves only if his/her toss is tails, moving toward the tail of the snake.  The first player to read the head or the tail of the snake wins.  The winning player should add a clothespin to the graph to record the win as heads or tails.

Class discussion should focus on analyzing the data to determine if the game is fair or not.   Directions and gameboard are included in the download.   This game was developed by a Monmouth University student for the Probability Fair. 


Download the Heads & Tails Game which includes the game mat, directions and icons for centers work boards.  This game is an excellent addition to a classroom math center, as students may play with a partner and record the results for class discussion at a later time.

Monday, February 21, 2011

Data Collection: Count in a Minute

Count in a Minute: First graders at Flynn School in Perth Amboy, NJ, created a large line plot of how high they could count in a minute. Student pairs worked together to time and count then post the results on the class graph.
  • The teacher presented the question to the class: How high do you think most first graders in this class can count in a minute? The teacher led a discussion that included student predictions and the reasons for their predictions.
  • The teacher created a large number line on the blackboard to form the basis of the line plot. The teacher used a timer to signal the start and end of the minute.
  • Students worked in pairs. First, student A counted aloud while student B listened. When the minute was over, student B wrote the highest number on a post-it and added it to the class results.
  • Students repeated the experiment: student B counted aloud while student A listened. These results were then added to the class results.
  • Data Analysis:  The teacher led a discussion of the results and whether or not the results were what they predicted. Why or why not?

Sunday, February 20, 2011

TV Survey

Sampling is a technique that is used in statistics to gather information about a lot of people or things without testing each one.   For instance, scientists pull a small container of water from the ocean to test to see if the beach is safe for swimming.   Many people follow this same procedure with their backyard pools, testing a small container to check pH levels. 

There are companies that gather this kind of information from a small number of people and make predictions about how a larger group will think or act.   For example, the Nielsen ratings gather information on which TV shows a small sample of Americans watch.   The Nielsen company then publishes which shows Americans watch the most or watch the least based on this small sample.   These are called the Nielsen ratings and they determine how much money advertisers pay for TV commercials.   The more people who watch the show, the more an advertiser will have to pay for a commercial during that show.   The Nielsen Company very carefully selects the people who participate in this sample so that they are representative of the country as a whole.   Unfortunately the end result is that sometimes your favorite TV show will not get a high Nielsen rating, and it may be cancelled by the TV station. 

TV Survey is an open-ended problem that was designed to introduce students to this real-life application of sampling.   Because TV is a part of students' daily life, this scenario is accessible to all students.   And, because students often exhibit a keen sense of "fairness," they are sometimes disconcerted by the notion that a small group of people get to decide what all of us get to watch on TV. 

TV Survey was also designed to address different Bloom levels so that students have to use higher-order thinking skills to analyze, synthesize and evaluate information about the sampling method. 

Download the TV Survey open-ended assessment.

Friday, February 18, 2011

Sampling: Mystery Bag

In the Mystery Bag activity, students take samples from four different bags and use those samples to predict the contents of the whole bag.   Students will tally the results of the samples, compare samples and match the samples to descriptions of the four bags.   Finally, small groups will report sample results to the whole class so that the class is able to review the results of this larger sample and decide if their predictions still hold. 

Sampling is used in polls, advertising, TV ratings, etc.  In this activity students will see firsthand how the size of the sample affects the accuracy.  Individual groups may pull skewed samples, but when the class data is combined, these larger samples should more accurately reflect the actual contents.  NOTE:  Be sure that students understand that they are sampling with replacement, meaning that they pull a tile, record the outcome, then replace the tile in the bag before pulling the next tile.

Download all materials and instructions for the Mystery Bag activity from Mathwire.

Tuesday, February 15, 2011

Online Cereal Toy Investigation Simulator


This applet, designed by Erin Mulder, allows students to conduct multiple simulations and collect data on a larger sample.   Students may run 20-30 trials more quickly than the dice toss.   The applet is probably best used following the class data collection simulation with 6-sided dice. 

In this simulation, students will need to collect data on the total number of boxes bought to get all 6 toys so they must decide how best to record that data.   The class must also decide on a method of recording the class data (e.g. adding to the class line plot using a different color marker would facilitate comparison of the results).   Discussion should center around how well the small class sampling results matched the larger computer-generated results. 

Directions for Cereal Applet:
  • Once the Applet is loaded, click on "Next Box" to buy a box of cereal.
  • A box of Cheerios and a toy will be added to the screen.
  • Click "Next Box" again to buy another box of cereal and get a free toy.
  • Keep clicking "Next Box" until you get all six toys.
  • The applet will stop at this point and tell you how many boxes you had to buy to get all six toys.
  • Students can then see how many of each toy they got.
  • When students have recorded this information for the trial, they click on "Reset" to begin a new trial.
  • Students should add these computer simulations to the class data for discussion. 
Run the online Cereal Toy Investigation Simulator.  [Java applet requires Java-enabled browser.]

Monday, February 14, 2011

Cereal Toy Investigation

This activity introduces students to the use of sampling for advertising purposes.   It also generates a discussion about how advertisers use gimmicks to get people to buy more of their product.   Even young students will admit that they have been induced to buy fast food meals in order to collect all of the toys.

The Plan: Many companies are putting toys in their products to try to get customers to buy more.   The company that makes Cheerios thinks this might be a good way to get families to buy more boxes of Cheerios.   They will make six different toys and put one in each box of Cheerios and Multi-Grain Cheerios.   That way kids will want their parents to keep buying Cheerios until they have all six different toys. 

Mrs. Oats, the President in charge of Cheerios, asks you to help figure out if this is a good plan.   She knows that it will cost more to put toys in Cheerios.   She wants to be sure that families will really buy more boxes of Cheerios to get the toys.  Mrs. Oats asks you to find the answers to these two questions:
  • What toy should Cheerios put in the boxes to make families want to buy more?
  • How many boxes will a family buy to be sure they collect all 6 toys?

"Guess"-timate: 
  • Ask students to think about how many boxes a family will have to buy to get all 6 different toys.
  • Have students share their "guess"-timates with the class and explain how they decided on that number.
  • Write all "guess"-timates on the board or chart paper for later reference. 
Read more about the Cereal Toy Investigation on Mathwire where you can view a step-by-step lesson plan and download materials needed for this data investigation.

Friday, February 11, 2011

Pig Dice App

Now you can play the game of Pig on your iPhone with this free app that allows you to play against the computer.  Be forewarned that the computer in this app is a formidable opponent!  That being said, the app is useful for trying out different winning strategies and it's a fun game to have available on your phone for those wait times.

Terry's Note:  I think it's great for kids to see that it's cool to have math games on your iPhone.  Try it!  

Thursday, February 10, 2011

Game of Pig

Game of Pig:  one die version

This is best introduced as a class activity.   Students collect points for each toss of the die unless a ONE is tossed, which means they lose all of the points they have collected in the round.   To prevent losing their points, students may elect to stop at any point in the game before a ONE is tossed and they get to keep the points they collected but get no further points.   Students love the game and begin to appreciate that theoretical probability and experimental probability are often quite different! 

Game Analysis:  Once students are familiar with the game, encourage small groups to develop a "winning strategy" and explain it to their classmates. Then play the class game with groups competing to see who has the best strategy in the actual game. Repeat, as necessary, for students to modify strategies.  NOTE:  Some student strategies are:  stopping after 5 tosses, stopping when they have 20 points, stopping after the second toss of a 6 or a 5, etc.  Be sure to ask students to explain the thinking behind the strategy.

Terry's Note:  I have used this with students in Grades 1-12 as well as in teacher training sessions and everyone loves it!  Students record each toss and then must add up a string of numbers providing great practice in mental math.  Students also continue to search for that magic strategy that will help them win.  Along the way, they informally experience, and thus learn, a lot about experimental probability.  I found this game to be a great use of those few minutes at the end of class to keep students actively engaged.  No student ever groaned when I said we were going to play pig!
  • Download directions for playing the Pig Game in a whole class setting.
  • Download the Pig Template to use as a recording sheet.  Place the sheet in a plastic sheet protector and use dry erase markers to create a reusable recording sheet.
  • Have students record each die toss in a Pig Tally Template for easy data collection.  This method also groups data so that students see a visual representation of the frequency of each outcome.
  • Use copies of the Pig Handout as a writing activity.  Encourage students to write about the probability in Pig and what they have learned from playing the game.  OR use these sheets for student groups to write out their "winning strategy" and post them on a bulletin board for future reference.  Keep a running total of times each strategy is successful in winning.
  • Play Pig online.
  
Game of Pig:  Two dice version
Students should be familiar with the one-die version of Pig before playing the 2-dice version.   Tossing a one on either die means that the player loses all points collected in that round, if he/she has not stopped before the one is thrown.   Any player who is still playing when snake-eyes (double ones) are thrown, loses all points collected thus far in the whole game! 

Game Analysis:  Students need to develop different strategies for playing this 2-dice version of Pig.   After playing several times, student pairs might analyze the two-dice frequency chart to calculate the probability of a one being tossed.   Students can use this information to develop a winning strategy and compete against other teams to see whose strategy is most successful. 
  • Download  a two-dice toss frequency chart for students to use in determining the probability of different outcomes.
  • See online directions for playing Two-dice Pig.
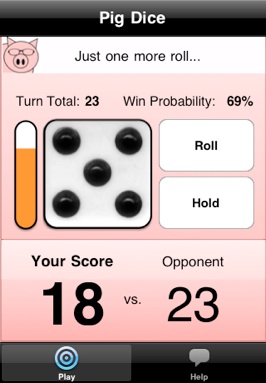
  • Play an online version of Two-dice Pig against the computer.
  • See Two Dice Roll for an online simulation of two-dice toss that graphs the outcomes.  This is a great way for students to collect larger samples of data to analyze experimental probability against theoretical probability.  Groups of students might also use this simulator to generate dice tosses to test their winning strategies.

 Game of Skunk
After students have mastered the Pig Game, analyzed the probability of the game and identified winning strategies, introduce the Game of Skunk and challenge students to analyze the probability used in this game and develop a winning strategy.   How are the games alike and how are they different?   Does the same "winning strategy" work for both games?  

Wednesday, February 9, 2011

Who Has? Decks

Once students have developed conceptual understanding of the basic operations they need to develop fluency with the facts.   One quick way to include daily practice and motivate students to master these basic facts is through the use of the Who Has? card decks.   These decks can be created for virtually any topic and frequent use as both a whole class practice or as a center activity for partners or small groups will provide facts practice in a highly-motivating format. 

Mathwire houses a math Who Has? collection that includes addition, subtraction, more/less, base ten, multiplication, coins, algebra, geometry, fractions and decimals.  Each file is formatted to print on 2x4 inch labels that may be affixed to index cards to easily create classroom card decks.  Use different colored index cards for different decks.

These Who Has? (or looping, as some sites call them) decks are popular with students and teachers.  Students enjoy the game, rehearsing their card as they wait for the clue.  Teachers find it particularly efficient because students mentally rehearse 20-30 different math facts throughout the course of the game.  Teachers who time the activity find that almost no students opt out once they read their cards.  Interestingly, they continue to practice the facts, tied in to the whole class performance for that round.

Monday, February 7, 2011

Grab the Candy Game: Valentine's Day Version

This game was designed as a Valentine's Day version of the original Grab the Candy Game.  Students place valentine heart candy on the grid, then toss dice, form an ordered pair, and remove a candy, if there is one in that space.

Students will practice forming ordered pairs, learning to name the horizontal then the vertical number or letter, an important skill in coordinate graphing.  The PDF document includes two versions:  the letter-number version pictured to the right where students name the space using a letter and number, e.g. B2.  The document also includes the traditional board where hearts are placed on the intersection of two lines and students use traditional ordered pairs.

Thursday, February 3, 2011

Problem Solving: Combinations

Valentine's Day Treat

This is a classic combination problem that challenges students to list all of the possible sundaes that can be made if students choose one ice cream and one topping from the cafeteria list. Note that students must choose a topping for this problem, otherwise they are simply buying ice cream which doesn't count as a sundae. 


This problem was designed as a simple primary level introduction to combinations and systematic counting.  The included possible solution details a simple way to introduce students to this method of counting combinations.  Older students might use a tree diagram to find all of the possible combinations.


  • Download Valentine's Day Treat which includes the student handout and a possible solution method using a simple listing of the different combinations.

Wednesday, February 2, 2011

Valentine Symmetric Faces

Reinforce the concept of symmetry with this art project which colored paper and symmetrical placement to create symmetric masks. Use red, pink and white paper for Valentine's day or red, white and blue paper for patriotic masks for President's Day. 

  • See Symmetric Faces for instructions on creating these masks from 1.5 sheets of construction paper. Students will develop an "eye" for symmetry as they correctly place cut pieces to create a symmetric face. 
  • See Symmetric Faces Photo Gallery  for ideas to get the creative juices flowing. Note how the color combinations as well as the facial features affect the final product.

Tuesday, February 1, 2011

Valentine Probability

These Valentine's Day activities are based on the small candy hearts popular around this holiday. Instead of sayings, these mathematical hearts have letters. 

Students are trying to accumulate all of the letters in the word VALENTINE or HEART. They first predict how many letters they will have to draw from the bag, then they conduct the experiment, collect and organize data and analyze the class results. 


Materials:
  • Download Valentine Probability for a straightforward probability handout.
  • Download Valentine Probability Investigation for the hearts and recording sheet to conduct the probability investigation on how many letters students will have to draw (with replacement) to get all of the letters in the word VALENTINE. 
  • Download Heart Probability Investigation for the hearts and recording sheet to conduct the simplified probability investigation on how many letters students will have to draw (with replacement) to get all of the letters in the word HEART.