Showing posts with label clothespin graph. Show all posts

Friday, December 9, 2011

Gingerbread Graph Ideas


It is very easy to incorporate graphing into a gingerbread man unit. Consider these possibilities to get the creative juices flowing. Remember to include different kinds of graphs as suggested below.
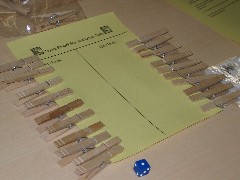
  • Gingerbread Info.: As an introduction to the unit, graph how many students have eaten a gingerbread cookie, baked a gingerbread cookie or decorated a gingerbread cookie. [clothespin graph with simple yes/no options]
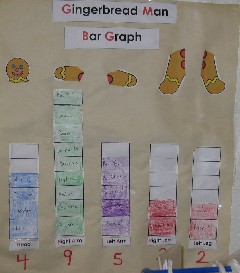
  • Gingerbread Bites: Ask students to take one bite of their gingerbread cookie.   Graph or tally how many students bit off the head, the right arm, left arm, right leg or left leg. [bar graph, as shown, or pictograph using pieces]
  • Gingerbread Taste Test: Have children taste several different gingerbread cookies, including homemade and store-bought. Ask students to vote for their favorite cookie. [bar graph]
  • Gingerbread Man Stories: After reading several different versions of the classic story, ask students to vote on their favorite. [pictograph using book die cuts]
  • Gingerbread Unit: At the conclusion of the gingerbread unit, have students vote on their favorite activity. [bar graph]

Friday, December 2, 2011

Counting Game: Run, Gingerbread Men, Run!


This game was designed to introduce students to the randomness of spinners and dice. Each color gingerbread man starts at the same place and has the same chance of winning by crossing the finish line, but does it work out that way? Students will enjoy playing the game AND use a clothespin graph [see sample on right] to collect some useful data on the winners.

Once students have collected class data from playing many games, they will come together to analyze the clothespin graph results. Students will be asked to discuss whether or not they think the game is fair for all of the gingerbread men and explain their reasoning.

Download the Run, Gingerbread Men, Run! game so that students can get started playing and collecting data. The pdf file contains the spinner, gameboard, clothespin graph icons, and an optional tally sheet.


Friday, October 14, 2011

Pumpkin Graphing


This month's featured graphing format is the clothespin graph which captures data from simple yes-no questions. Use a piece of oaktag or foam board to construct the actual graph part that is reused. Write the question on a sheet of paper and attach it to the top of the board. Provide clothespins for students to use to affix to the yes or no side of the graph. Some teachers write student names on the clothespins so that it is easy to see who did or didn't vote yet.


  • Do you like pumpkin pie?
  • Have you ever gone to a pumpkin farm to pick out  a pumpkin?
  • Do you like to eat pumpkin seeds?
  • Have you ever carved a jack-o-lantern?
A clothespin graph may also be used to record data for any two-choice option.
  • Will your holiday costume be friendly or scary?
  • Did heads or tails win the game?
  • Will you go away for Thanksgiving or eat at home?

Tuesday, February 22, 2011

Clothespin Graph

Write each student's name on a clothespin. A piece of foam core board or laminated oak tag makes a great two-choice (Yes/No) graph board. Students simply affix the clothespin to the correct side to indicate their response. Students can easily "see" the results and count to verify the outcome.
  • Use this method to record the results of informal classroom surveys:
    • Literature: Which character do you like best? What do you think the character will do next? Which version of the story do you prefer?
    • Daily Routines: Are you buying lunch or did you bring lunch? Present or Absent?
  • Ask students to report the results of who won two-player games so that the class can analyze the fairness of the games. 
Suggested Use:  Use a clothespin graph to record the results of students playing the Heads & Tails Game.  

In this game, each student places a penny on the star.  One student is heads and the other student is tails.   Students should place their pennies with the appropriate side up.

The heads student tosses a penny and moves a space toward the head if the outcome is heads.  If the outcome is tails, the student does not move.  Play repeats with the tails student, who moves only if his/her toss is tails, moving toward the tail of the snake.  The first player to read the head or the tail of the snake wins.  The winning player should add a clothespin to the graph to record the win as heads or tails.

Class discussion should focus on analyzing the data to determine if the game is fair or not.   Directions and gameboard are included in the download.   This game was developed by a Monmouth University student for the Probability Fair. 


Download the Heads & Tails Game which includes the game mat, directions and icons for centers work boards.  This game is an excellent addition to a classroom math center, as students may play with a partner and record the results for class discussion at a later time.

Thursday, October 7, 2010

Clothespin Graphs

Use a clothespin graph for a simple daily graphing experience.  Many teachers write each student's name on a clothespin that students then use in classroom data collection activities.  This is a simple visual data collection that lends itself to picture cues for younger students or questions for readers.

Add this graphing model to your fall classroom activities:
  • Do you like fall or winter best?
  • Do you help rake leaves?
  • Have you ever bobbed for apples?
  • Do you prefer red or green apples?
  • Will you carve a pumpkin for Halloween?
  • Will your jack-o-lantern be cute or scary?
The list could go on and on.  It's easy to divide a student white board into halves or quarters for four choices.  Students may easily clip their clothespins to the space that represents their choice.  Did heads or tails win the game? 

This data collection activity lends itself to other curricular areas as well.  For example, students might vote on their favorite version of a familiar story or vote on whether or not they were born in the same state where they currently live, etc.

Preschool and primary teachers often find that a clothespin graph is a great way to take attendance.  As students enter the classroom and get settled, they move their clothespin to the Here side.  This makes it easy for teachers to check attendance and students easily see how many people are absent(not here) that day. 

Think about ways to add a clothespin graph to math class.  Please share your ideas on using this simple yet powerful data collection tool.