Friday, February 22, 2013

Mathwire Dr. Seuss Activities

Many schools celebrate the birthday of Theodor Geisel, better known as Dr. Seuss. Consider adding mathematical activities to these celebrations. One fish, two fish, red fish, blue fish is an especially good introduction to combinations. Use the Mathwire open-ended problems written to accompany this book. The problems may be used with older grades who enjoy hearing their childhood book read aloud.

Primary students will enjoy completing Seussical Patterns, using the classic red and white striped Seuss hat.

See more Mathwire Dr. Seuss activities.

Saturday, March 17, 2012

Math Alive!

The Smithsonian Institute is currently hosting the Math Alive! exhibit.  From the website:

  • MathAlive! is designed to inspire, to spark the imagination, to reveal not only math at work, but the endless possibilities of math. Designed for families and students the exhibition brings to life the real math behind what kids love most - video games, sports, fashion, music, robotics, and more - and creates interactive and immersive experiences that bring to life the math at work in each, whether in design, application or use. 
If you're planning a trip to the Washington, DC area, be sure to include this exhibit in your itinerary.

Visit the Math Alive! website for more information on the exhibit and to sample some of the online games and activities.

Friday, March 16, 2012

Making Predictions

Making predictions is an important step in all data collection activities.  After a brief explanation of the problem or experiment, students are asked to think about what they expect the results to be and make a prediction.  The teacher leads a discussion of the predictions and the reasoning behind them, often posting these on chart paper for future reference during the data analysis phase.


I recently read a study on this very subject.  It found that having students make predictions about new math situations or problems did indeed foster deeper mathematical thinking and understanding in students.  Additionally, this practice also increased student engagement in the task, as they were invested in the results.


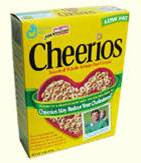
One data collection activity I have used with students from kindergarten through middle school, is the Cheerios Investigation.  Students are told about an advertising campaign in which Cheerios randomly includes one of six toys in each box of Cheerios.  They hope that this will prompt families to buy more boxes of Cheerios trying to get all six toys.  Students are asked to think about this and predict how many boxes of Cheerios the average family would need to buy to get all six toys.


The teacher then leads a discussion about the predictions, including the reasoning behind them.   In my experience, there's always the eternal optimist (or naive person) who says six.  Then there's the off-the-cuff response of 100 or some other large number.  The most popular response is 36, although I've yet to hear an adequate mathematical reason for that number.  Nonetheless, the teacher accepts all predictions and reasoning, posting them on a chart for later reference.


Students then conduct the simulation, using a die and tallying the results until they have indeed gotten each of the six toys (each toy represented by a number 1-6 on the die).  They post their results on the class line plot, then repeat the experiment as time allows.


The class line plot is the basis for the data analysis.  Students may compare their small sample to the larger class sample.  Discussion may include mean, median, mode, range, outliers, etc., as appropriate for the class level.  Finally, students are asked to write an analysis of the data, this time in a letter to Mr. (or Mrs.) Oats, explaining why the plan to include toys will increase the number of boxes of Cheerios families will buy.


It's a simple activity but it leads to rich mathematical discussion and students are actively involved and engaged in the results from beginning to end.  Additionally, if several classes in the school conduct this experiment, classes can share results to generate an even larger sample.


See  Mathwire's Cereal Toy Investigation to view a lesson plan and download handouts.


Mathwire also offers the Cereal Toy Investigation applet, designed to allow students to quickly generate larger samples, extending the die-toss experience.  Students simply click the Next Box button to buy another cereal box.  The applet is designed to stop when the student has accumulated all six toys so that students may record this number before running another trial.   [Note:  This app requires Java.]


Thursday, March 15, 2012

Dynamic Paper

Be sure to check out the Dynamic Paper app from NCTM's Illuminations site.  This app allows teachers to customize and print out graph paper, grids, number lines, tessellations, spinners, pattern blocks and more.  Users control the number of sections in the spinner and colors.  Likewise, users set the size of the sides of pattern blocks or the range of the number line. 


Dynamic Paper is a great resource for teachers designing activities to support math learning.  It's also an invaluable tool for teachers needing to differentiate classroom learning activities to meet the varied needs of learners in their classrooms.


Check out Dynamic Paper.